Hurricanes in Roatán: what 132 years of records actually say
The question comes up every time October is mentioned: does Roatán get
hurricanes? The honest answer is neither "no" nor "be careful". It is a
number, and it has existed since 1892.
Is there a storm near Roatán right now?
This block reads the National Hurricane Center directly. The map is their official seven-day outlook for the Atlantic; the marker is Roatán, placed from its coordinates. The distances are ours, measured from each storm position to the island.
Roatán
Seven-day tropical outlook, National Hurricane Center. Roatán marked by us.
Every storm that passed within 100 km of Roatán, since 1892
This is not an estimate. It comes from HURDAT2, the National Hurricane Center’s Atlantic database, which records the position and wind of every storm every six hours since 1851. We measured the distance from each position to Roatán.
43storms in 132 years, all intensities
15were hurricanes as they passed 64 knots (119 km/h) or more
Of the 43, counted by what each one was as it passed Roatán: 15 hurricanes · 17 tropical storms · 10 tropical depressions · 1 non-tropical low.
Hurricane season on Roatán, inside the Caribbean
Hurricane season in the Caribbean runs from 1 June to 30 November, the dates set by the National Hurricane Center. For Roatán those dates are not administrative: all 43 storms in this record fall inside them, without a single exception since 1892.
And they cluster. 29 of the 43 passed in September or October alone: two months out of twelve carrying two thirds of the total. Outside 1 June to 30 November, the record is empty.
What these words actually mean
The National Hurricane Center classes a system by its sustained wind. The names are not interchangeable, and the gap between the first and the last is the difference between a rainy afternoon and a roof coming off.
Non-tropical low
Not a tropical system: no warm core, no organised centre. Rain and wind, no name of its own.
Tropical depression
Under 34 knots (63 km/h). Organised, but too weak to be named.
Tropical storm
34 to 63 knots (63 to 118 km/h). This is when it gets a first name. Rain, choppy sea, boats stay in.
Hurricane
64 knots (119 km/h) and up, graded 1 to 5 on the Saffir-Simpson scale. Category 1 starts at 119 km/h, category 5 at 252 km/h.
The last 30 years
13 storms, of which 4 were hurricanes as they passed. That is roughly one approach every 2.3 years, and one hurricane every 8 years.
2
1890
1900
1
1910
5
1920
4
1930
6
1940
1
1950
4
1960
4
1970
2
1980
4
1990
1
2000
6
2010
3
2020
Storms per decade, within 100 km. It is not getting worse: the busiest decades are the 1940s and the 2010s, with 6 each. hurricane as it passedtropical storm or weaker
Seen from above
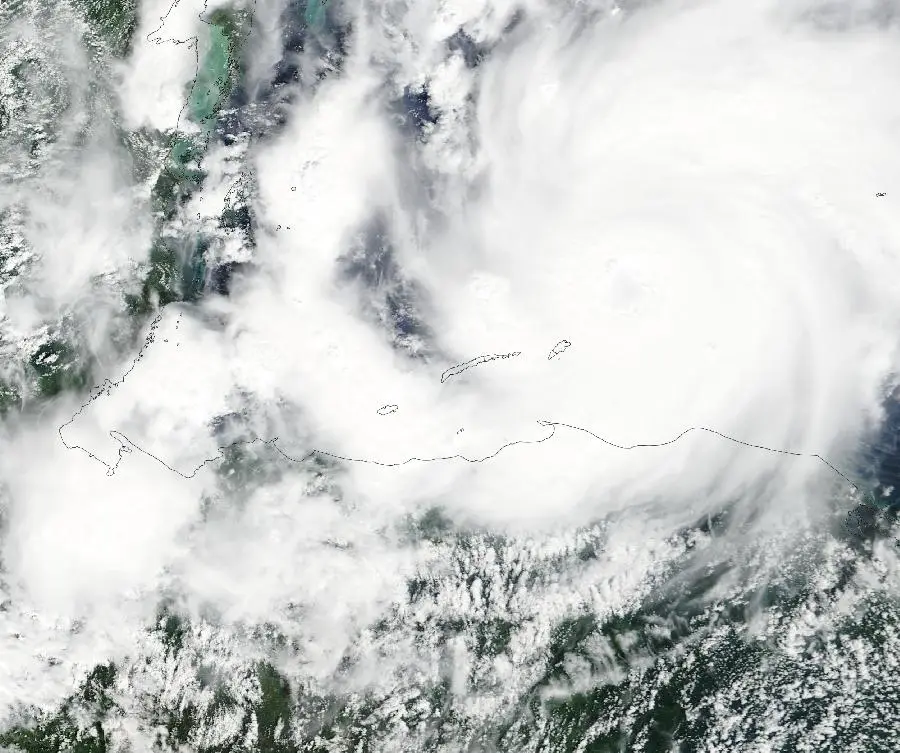
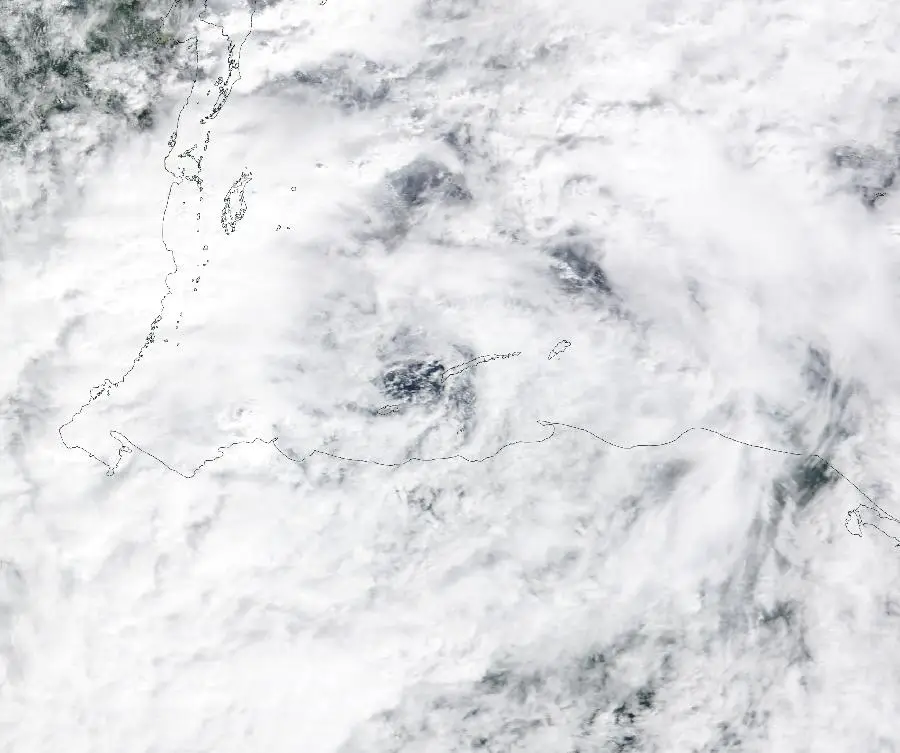
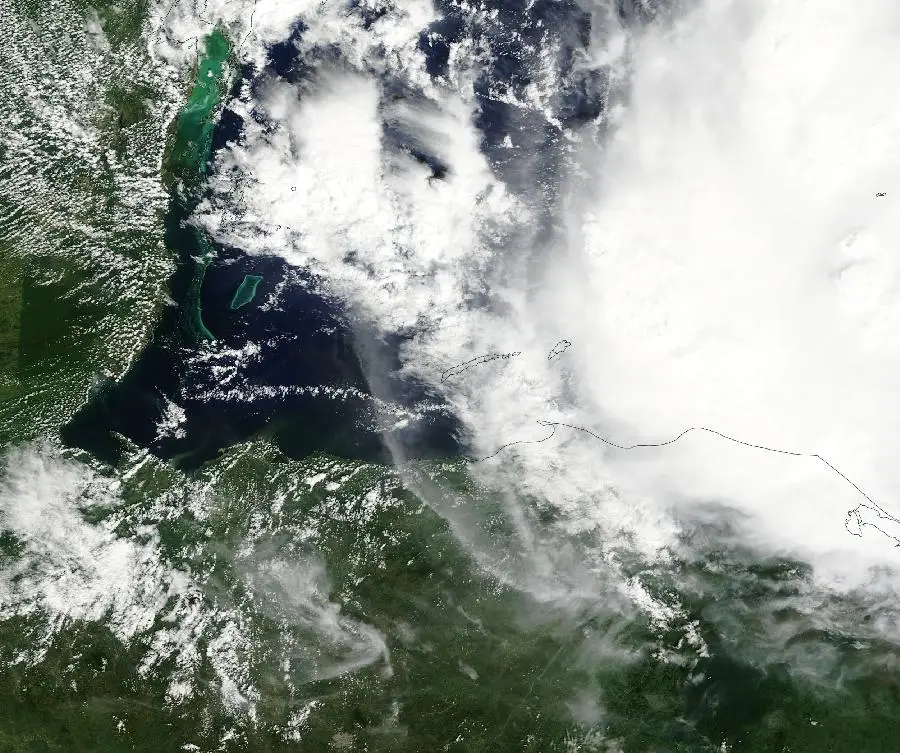
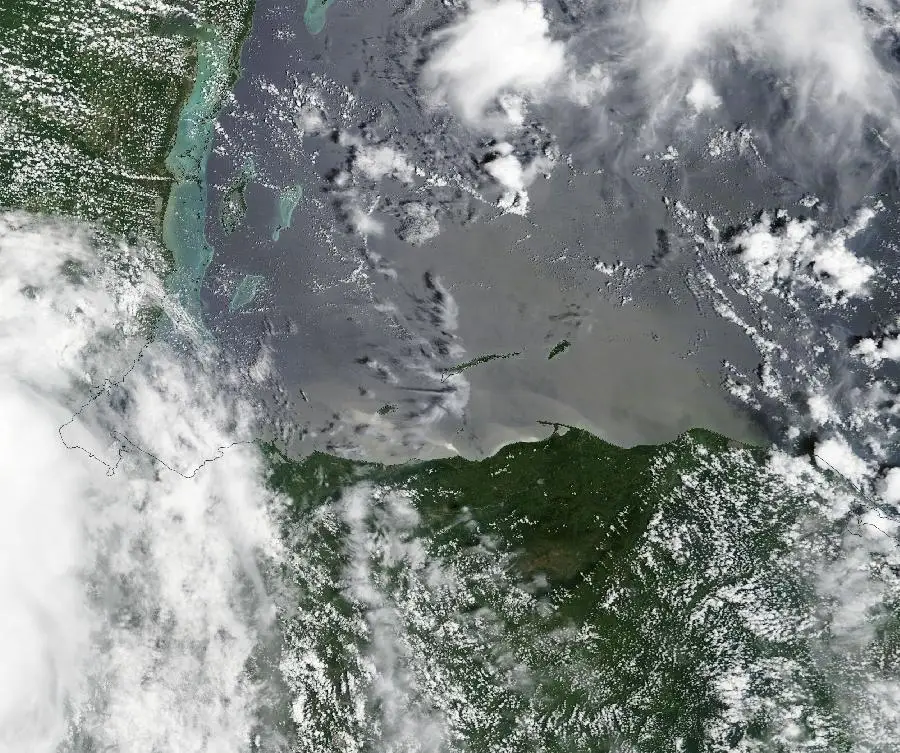
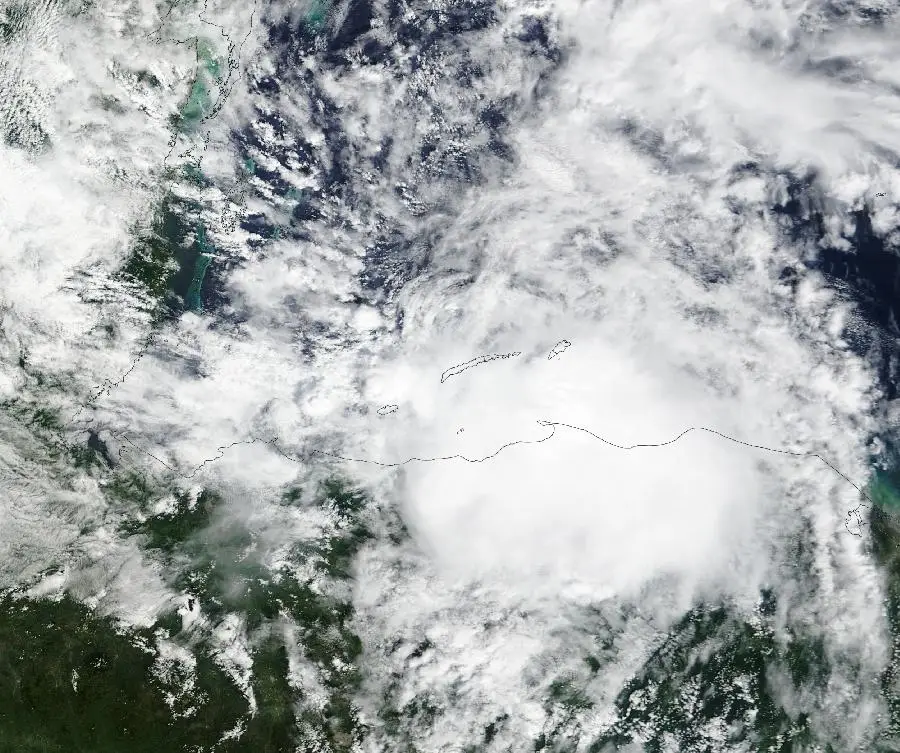
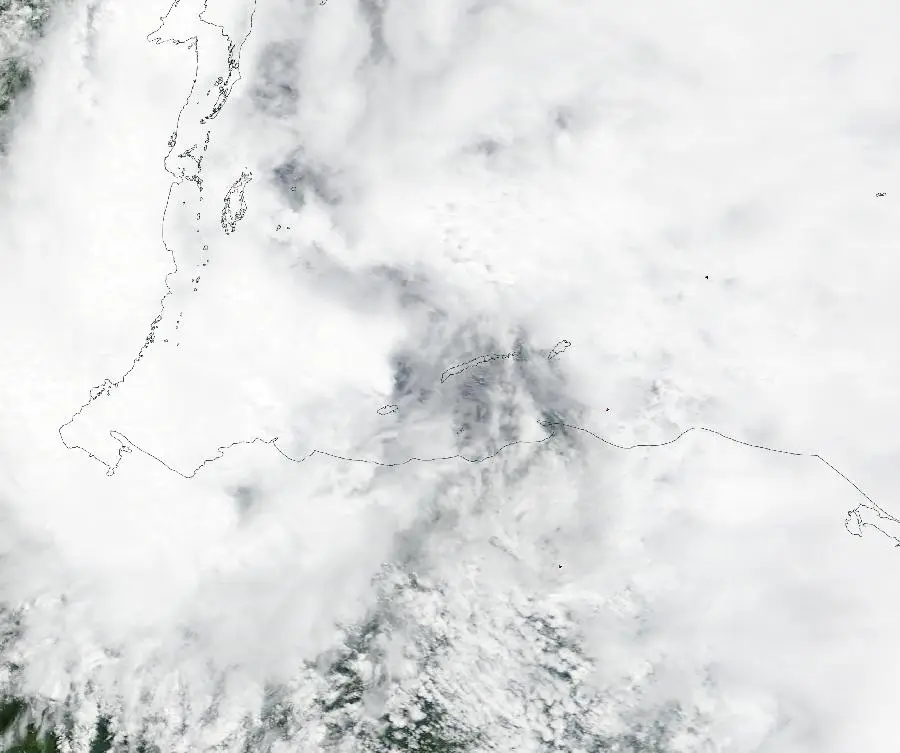
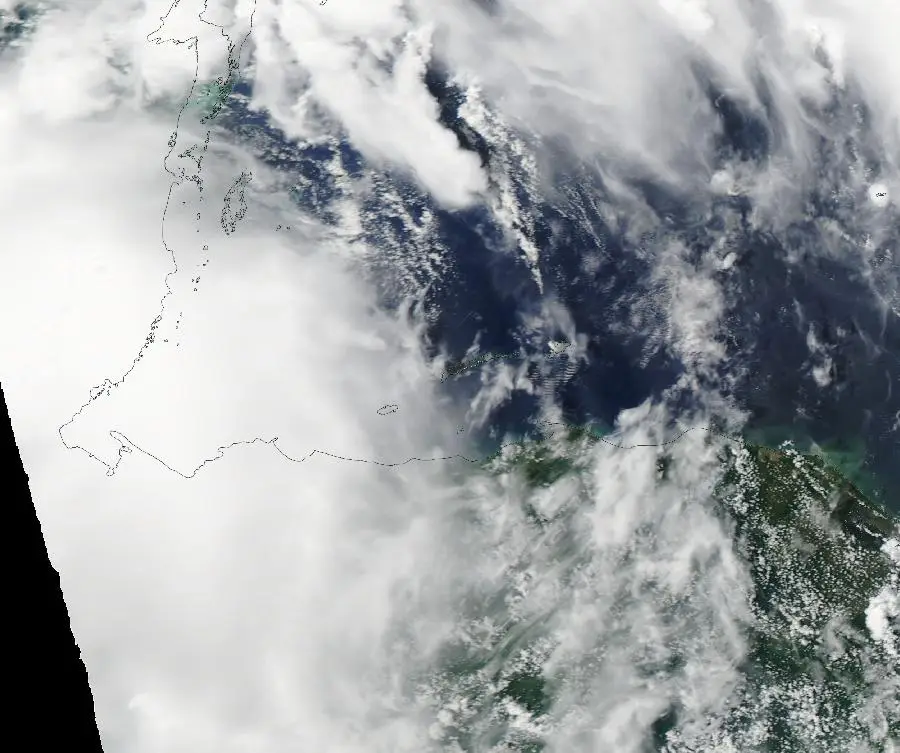
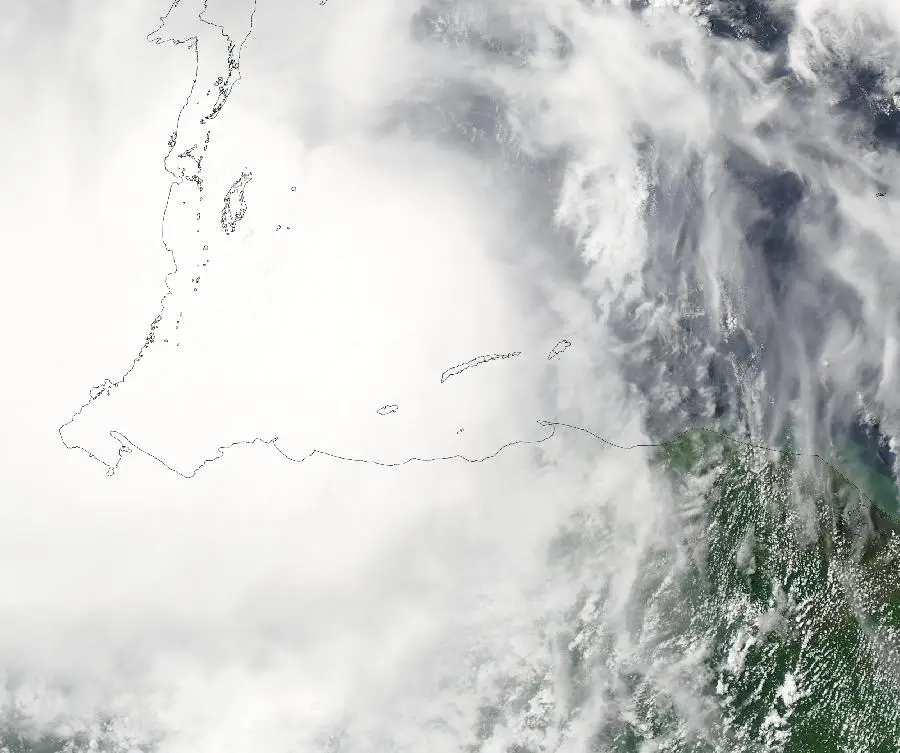
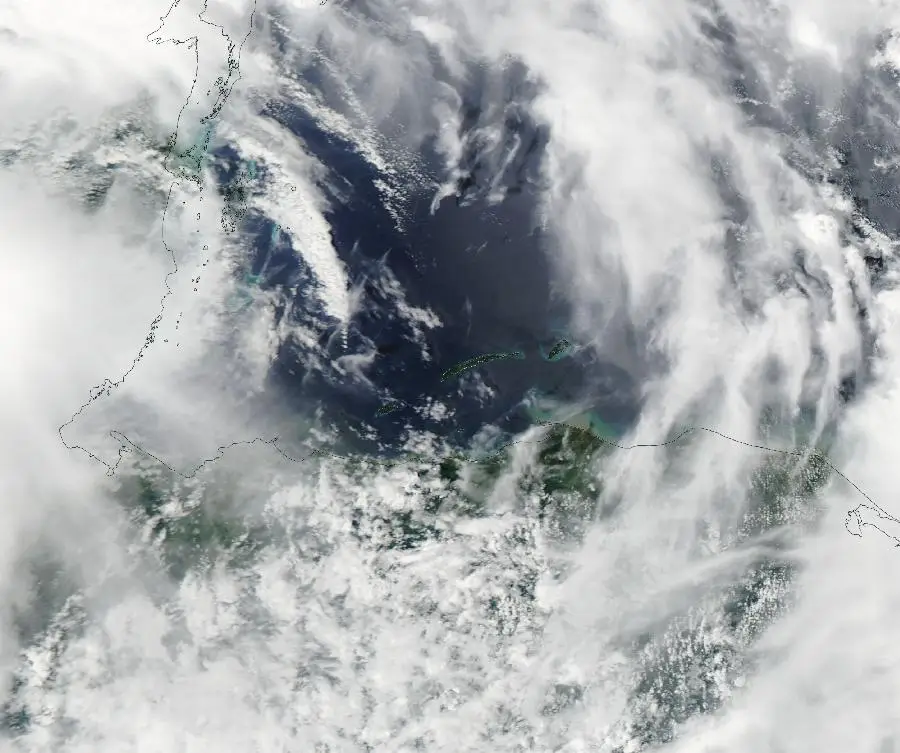
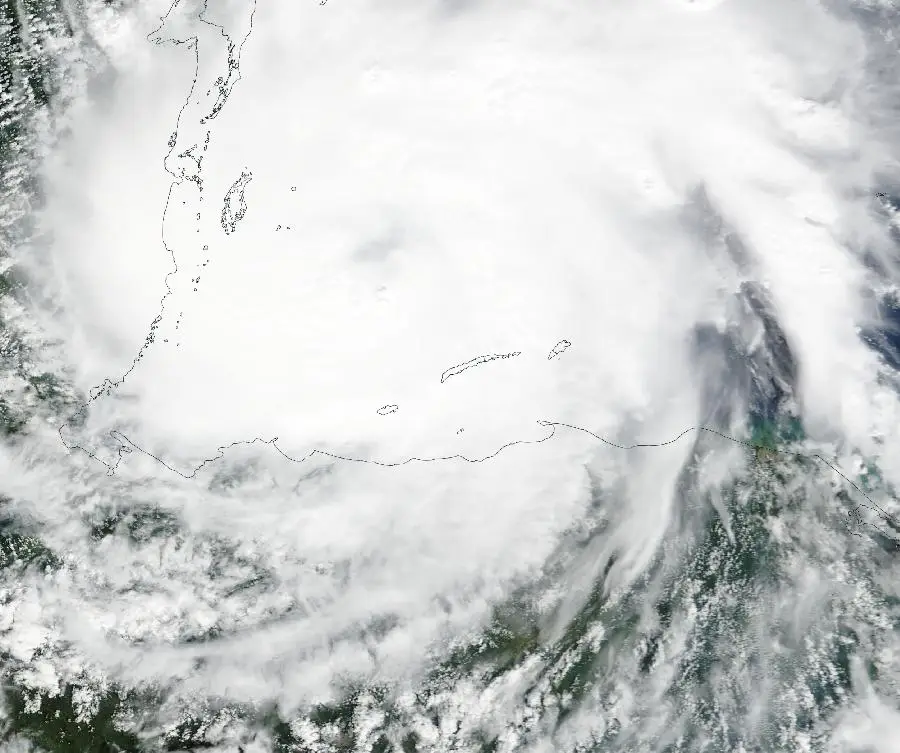
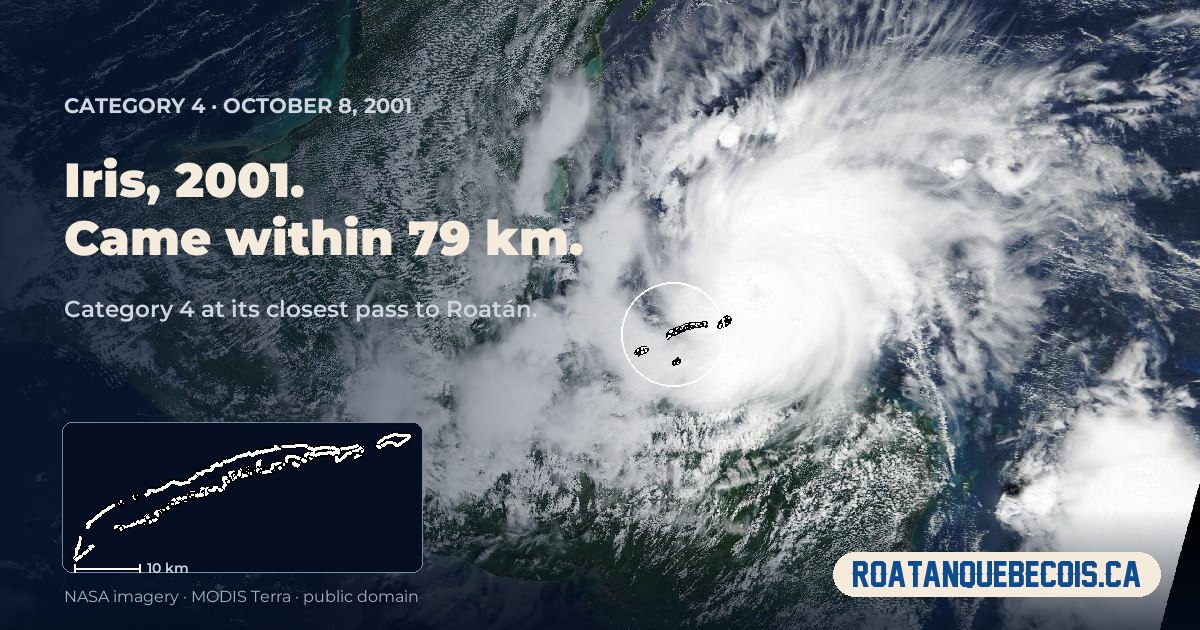
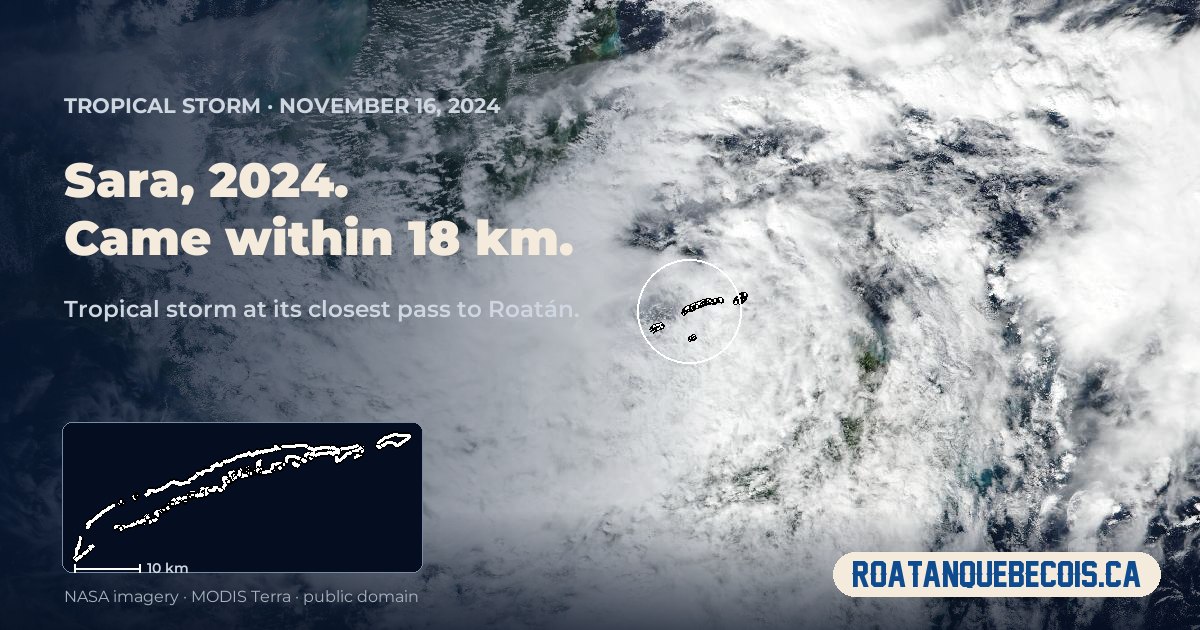
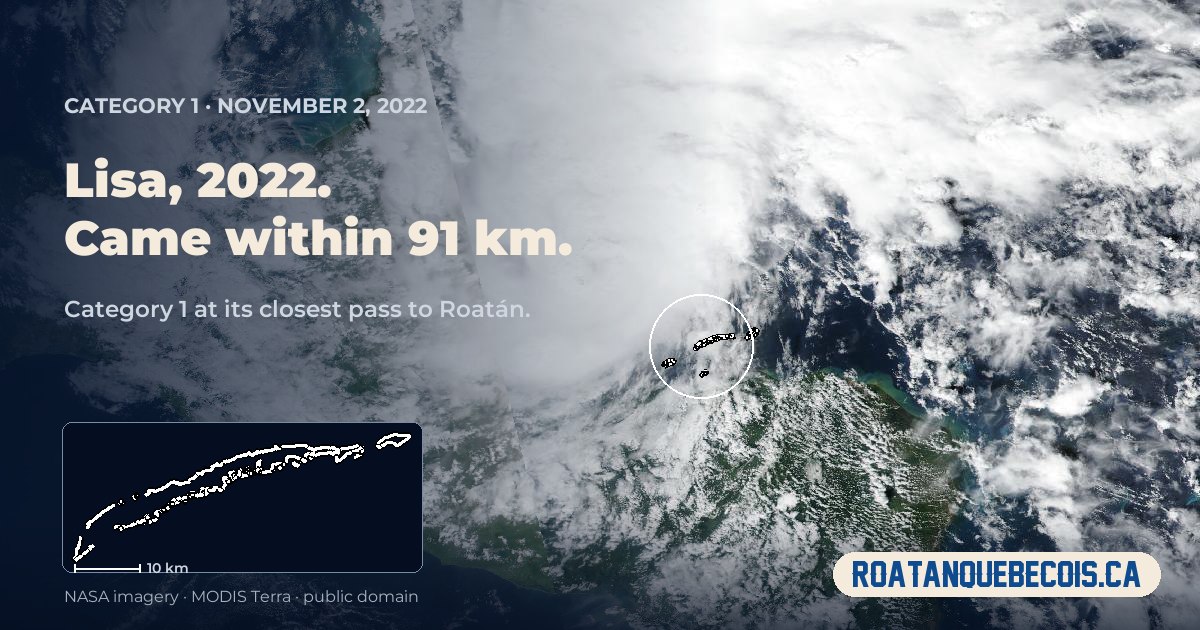
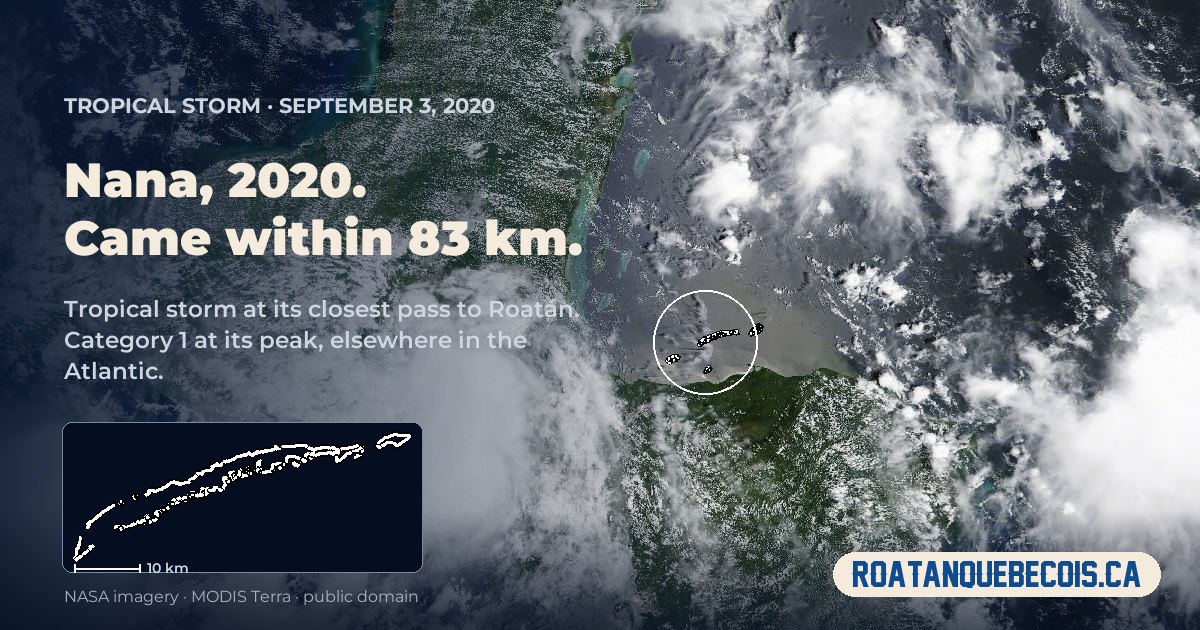
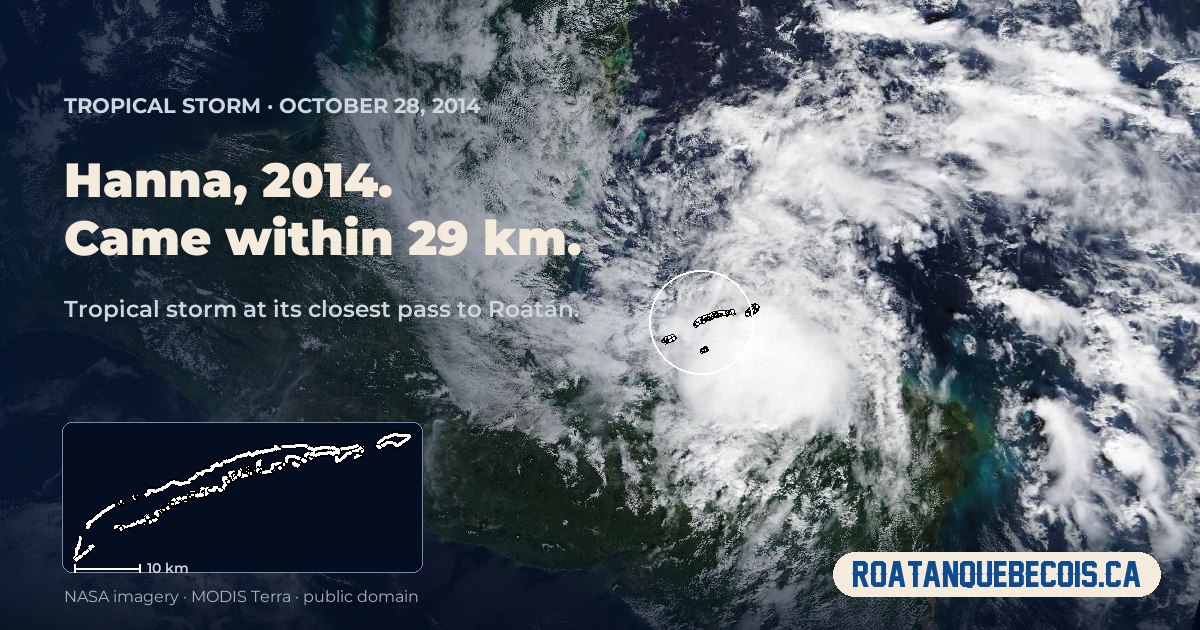
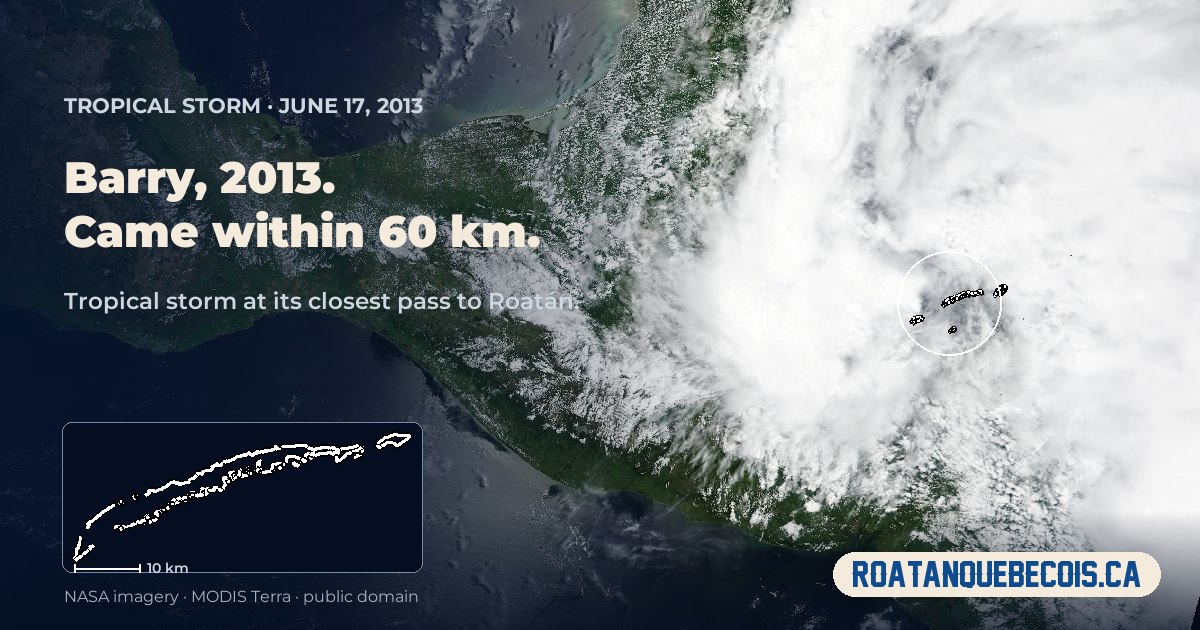
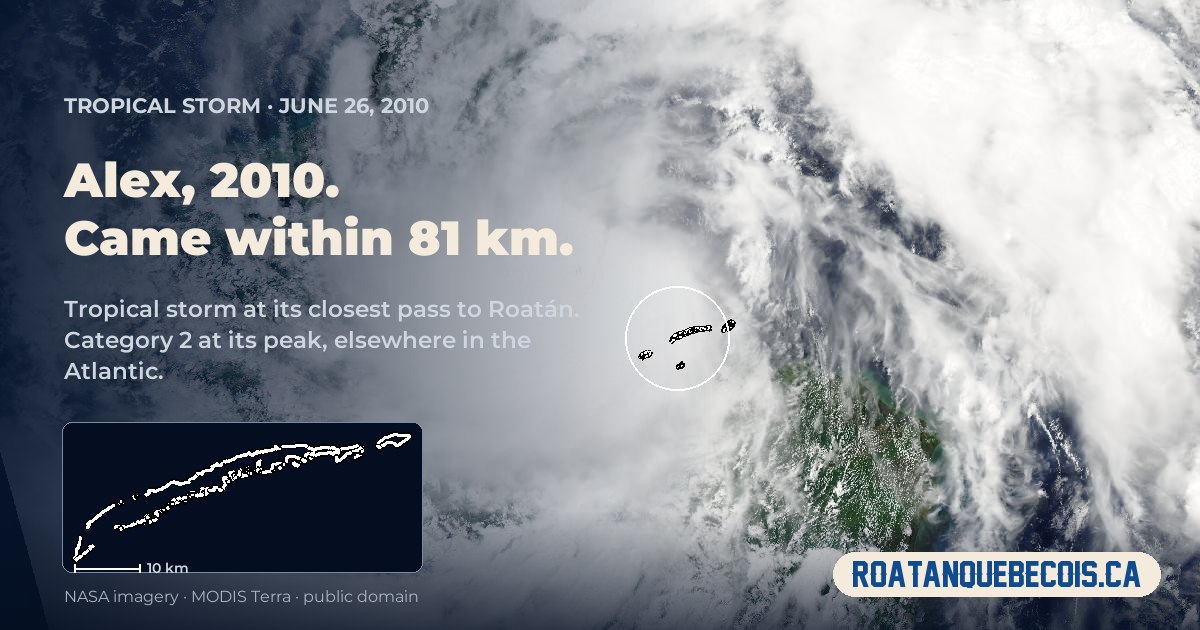
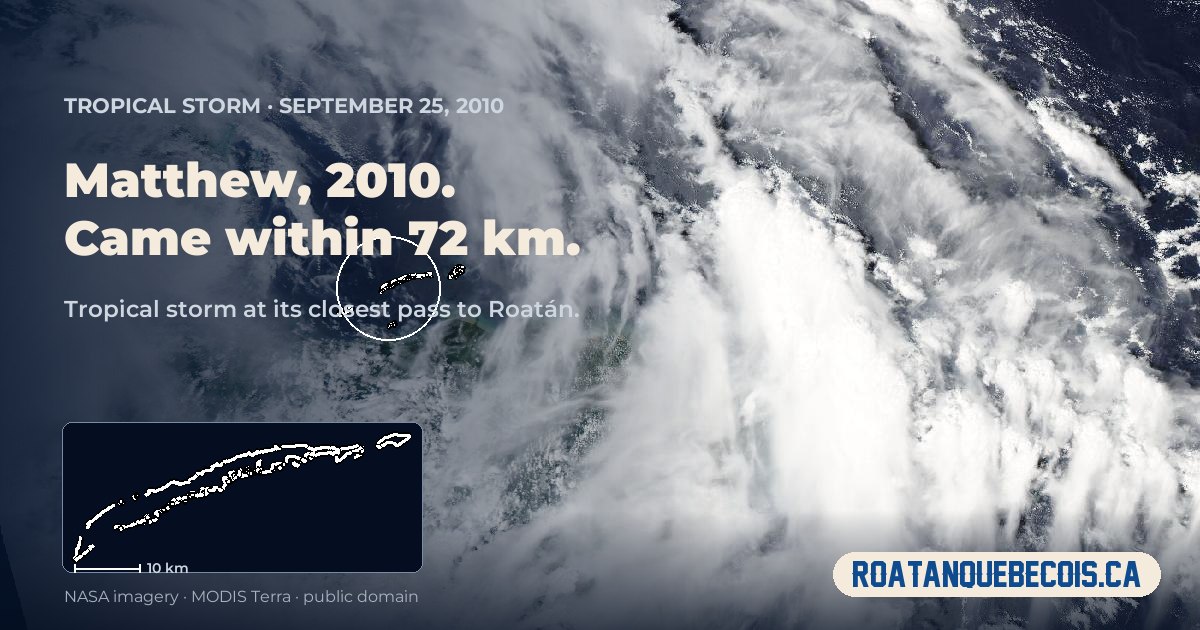
These are real satellite passes, on the day each storm came closest. The coastline is drawn by NASA; the marker is Roatán, placed from its coordinates. Same frame on every image, so they can be compared.
Roatán
IRIS, October 8, 2001
· hurricane, category 4 · 115 kt (213 km/h) passing
· 79 km away
⬇ Share this storm
SARA November 16, 2024 tropical storm 18 km · 40 kt (74 km/h)
⬇ Share this storm
LISA November 1, 2022 hurricane, category 1 91 km · 70 kt (130 km/h)
⬇ Share this storm
NANA September 3, 2020 tropical storm 83 km · 60 kt (111 km/h)
⬇ Share this storm
HANNA October 28, 2014 non-tropical low 29 km · 20 kt (37 km/h)
⬇ Share this storm
BARRY June 17, 2013 tropical depression 60 km · 30 kt (56 km/h)
⬇ Share this storm
HARVEY August 20, 2011 tropical storm 60 km · 50 kt (93 km/h)
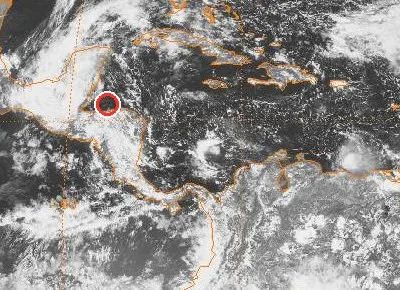
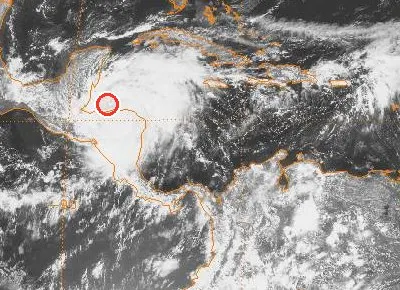
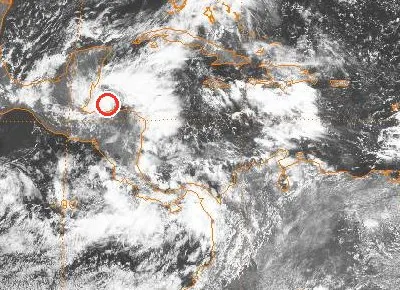
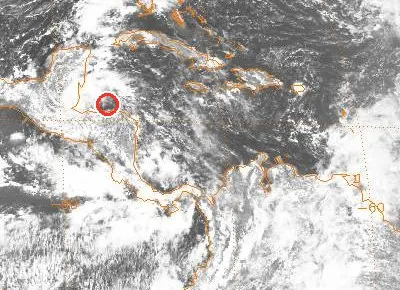
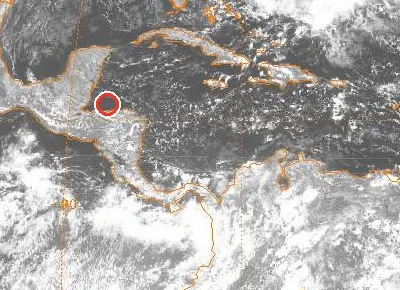
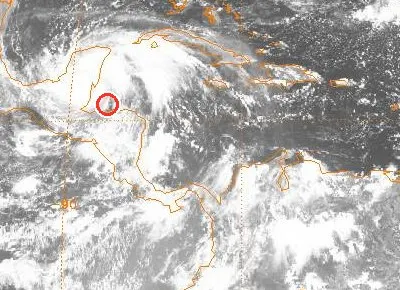
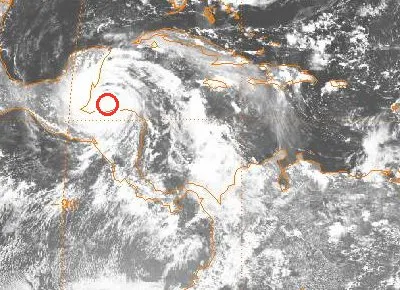
MODIS has only flown since February 2000. But the geostationary satellites have been watching the Caribbean since the 1970s, and NOAA keeps the archive. These are grey, at about 10 km per pixel, seen from 36,000 km: you will not see the island, you will see the storm over Central America.
KATRINA October 31, 1999 GOE-8 · 18 h UTC
MITCH October 29, 1998 GOE-8 · 18 h UTC
KYLE October 11, 1996 GOE-8 · 15 h UTC
— September 25, 1994 GOE-7 · 18 h UTC
— October 17, 1980 SMS-2 · 18 h UTC
HERMINE September 22, 1980 SMS-2 · 18 h UTC
GRETA September 18, 1978 GOES2 · 18 h UTC
The coastlines are drawn by NOAA inside the image. The Roatán marker is ours, computed by perspective projection and checked against a control point placed on the Honduran coast: 7 pixels of error on all seven.
And the ones with no image at all (8)
FIFI 1974 : l'image du 18 septembre existe mais ne porte aucun trait de cote et la moitie du disque est detruite par le striage du balayage : un repere y serait invérifiable
— 1975 : aucun geostationnaire sur les Caraibes, seulement des satellites polaires
EDITH 1971 : seulement une mosaique mondiale de satellites polaires a ~22 km le pixel, assemblee sur plusieurs orbites : aucune heure de passage
FRANCELIA 1969 : seulement une mosaique mondiale de satellites polaires a ~22 km le pixel, assemblee sur plusieurs orbites
— 1964 : aucun satellite meteorologique en service
ANNA 1961 : aucune image a cette date : TIROS-1 ne vole que depuis avril 1960 et rien n'en est archive ici
ABBY 1960 : aucune image a cette date
GILDA 1954 : TIROS-1, le premier satellite meteo, ne vole qu'en avril 1960
Sustained winds of 64 knots (119 km/h) or more at the moment they passed Roatán. That is the National Hurricane Center threshold. The last column is not about Roatán. It gives the strongest that storm ever got, anywhere along its whole track, sometimes thousands of kilometres from here. The two numbers can be far apart: EDITH (1971) reached 140 kt (259 km/h) at its peak, but was down to 65 kt (120 km/h) by the time it passed us. The rows with a small dot carry a satellite image: click anywhere on the row.
Hurricanes as they passed
Closest approach
Storm
Distance
What it was, passing
Its strongest, anywhere on its track
Nov 2, 2022
91 km
hurricane, category 1 · 70 kt (130 km/h)
category 1 · 148 km/h
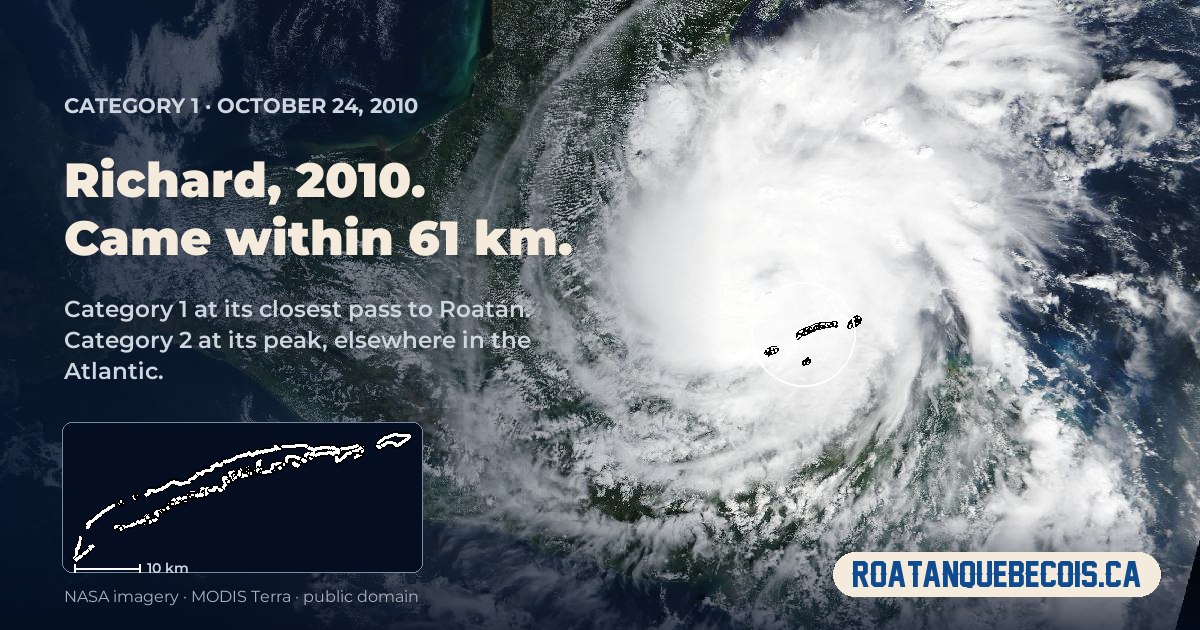
Oct 24, 2010
61 km
hurricane, category 1 · 75 kt (139 km/h)
category 2 · 157 km/h
Oct 8, 2001
79 km
hurricane, category 4 · 115 kt (213 km/h)
category 4 · 232 km/h
Oct 29, 1998
79 km
hurricane, category 2 · 85 kt (157 km/h)
category 5 · 287 km/h
Sep 18, 1978
52 km
hurricane, category 3 · 100 kt (185 km/h)
category 4 · 213 km/h
Sep 19, 1974
FIFI
23 km
hurricane, category 2 · 95 kt (176 km/h)
category 2 · 176 km/h
Sep 10, 1971
EDITH
45 km
hurricane, category 1 · 65 kt (120 km/h)
category 5 · 259 km/h
Sep 2, 1969
FRANCELIA
21 km
hurricane, category 2 · 85 kt (157 km/h)
category 2 · 157 km/h
Jul 24, 1961
ANNA
29 km
hurricane, category 1 · 75 kt (139 km/h)
category 2 · 167 km/h
Jul 15, 1960
ABBY
7 km
hurricane, category 1 · 70 kt (130 km/h)
category 1 · 130 km/h
Oct 4, 1945
unnamed
57 km
hurricane, category 1 · 80 kt (148 km/h)
category 1 · 148 km/h
Sep 28, 1941
unnamed
56 km
hurricane, category 1 · 70 kt (130 km/h)
category 4 · 213 km/h
Sep 10, 1931
unnamed
78 km
hurricane, category 3 · 105 kt (194 km/h)
category 4 · 213 km/h
Jul 6, 1893
unnamed
72 km
hurricane, category 1 · 80 kt (148 km/h)
category 2 · 157 km/h
Oct 12, 1892
unnamed
37 km
hurricane, category 1 · 80 kt (148 km/h)
category 2 · 157 km/h
Tropical storms and weaker 28
Below 64 knots as they passed. Seven of them were hurricanes elsewhere on their track: Alex, in 2010, peaked at 95 knots (176 km/h) but was down to 40 (74 km/h) over Roatán. The last column is not about Roatán. It gives the strongest that storm ever got, anywhere along its whole track, sometimes thousands of kilometres from here. The two numbers can be far apart: EDITH (1971) reached 140 kt (259 km/h) at its peak, but was down to 65 kt (120 km/h) by the time it passed us. The rows with a small dot carry a satellite image: click anywhere on the row.
Tropical storms and weaker
Closest approach
Storm
Distance
What it was, passing
Its strongest, anywhere on its track
Nov 16, 2024
18 km
tropical storm · 40 kt (74 km/h)
tropical storm · 83 km/h
Sep 3, 2020
83 km
tropical storm · 60 kt (111 km/h)
category 1 · 120 km/h
Oct 28, 2014
29 km
non-tropical low · 20 kt (37 km/h)
tropical storm · 65 km/h
Jun 17, 2013
60 km
tropical depression · 30 kt (56 km/h)
tropical storm · 74 km/h
Aug 20, 2011
60 km
tropical storm · 50 kt (93 km/h)
tropical storm · 102 km/h
Sep 25, 2010
72 km
tropical storm · 45 kt (83 km/h)
tropical storm · 93 km/h
Jun 26, 2010
81 km
tropical storm · 40 kt (74 km/h)
category 2 · 176 km/h
Oct 31, 1999
34 km
tropical depression · 25 kt (46 km/h)
tropical storm · 65 km/h
Oct 11, 1996
90 km
tropical storm · 45 kt (83 km/h)
tropical storm · 83 km/h
Sep 25, 1994
38 km
tropical depression · 30 kt (56 km/h)
tropical depression · 56 km/h
Oct 17, 1980
13 km
tropical depression · 25 kt (46 km/h)
tropical depression · 46 km/h
Sep 22, 1980
91 km
tropical storm · 55 kt (102 km/h)
tropical storm · 111 km/h
Oct 29, 1975
unnamed
45 km
tropical depression · 25 kt (46 km/h)
tropical depression · 46 km/h
Nov 9, 1964
unnamed
61 km
tropical depression · 30 kt (56 km/h)
tropical storm · 111 km/h
Sep 27, 1954
GILDA
44 km
tropical storm · 55 kt (102 km/h)
tropical storm · 111 km/h
Oct 22, 1943
unnamed
78 km
tropical storm · 40 kt (74 km/h)
tropical storm · 74 km/h
Sep 22, 1942
unnamed
56 km
tropical storm · 40 kt (74 km/h)
tropical storm · 83 km/h
Aug 3, 1942
unnamed
55 km
tropical storm · 35 kt (65 km/h)
tropical storm · 93 km/h
Sep 20, 1940
unnamed
57 km
tropical storm · 35 kt (65 km/h)
tropical storm · 83 km/h
Jun 4, 1934
unnamed
93 km
tropical depression · 30 kt (56 km/h)
category 2 · 157 km/h
Oct 1, 1932
unnamed
81 km
tropical storm · 40 kt (74 km/h)
category 4 · 232 km/h
Aug 15, 1931
unnamed
93 km
tropical storm · 45 kt (83 km/h)
tropical storm · 93 km/h
Oct 16, 1927
unnamed
38 km
tropical depression · 30 kt (56 km/h)
tropical storm · 74 km/h
Oct 4, 1926
unnamed
14 km
tropical storm · 35 kt (65 km/h)
tropical storm · 65 km/h
Sep 27, 1924
unnamed
61 km
tropical depression · 25 kt (46 km/h)
category 1 · 120 km/h
Jun 17, 1921
unnamed
72 km
tropical storm · 40 kt (74 km/h)
category 1 · 148 km/h
Sep 19, 1920
unnamed
12 km
tropical storm · 35 kt (65 km/h)
category 2 · 157 km/h
Jul 11, 1917
unnamed
34 km
tropical depression · 30 kt (56 km/h)
tropical storm · 83 km/h
What this does not say
The older count is INCOMPLETE: before satellites, a storm that crossed no shipping lane was never recorded. The 1850s to the 1950s are therefore undercounted, and this record does NOT support saying that storms are becoming more frequent. HURDAT2 gives a track and a wind, never damage.
The table above gives wind and distance. It does not say what happened on the ground. Here is what the records show, storm by storm, and only for the five where a solid source exists.
Mitch, 1998 : Roatán was not Guanaja
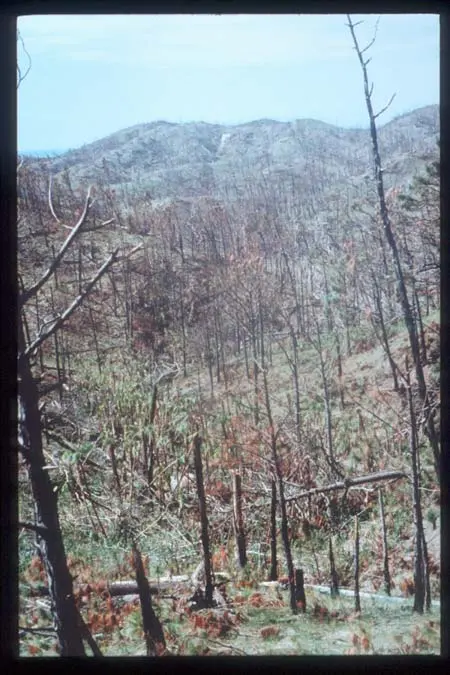
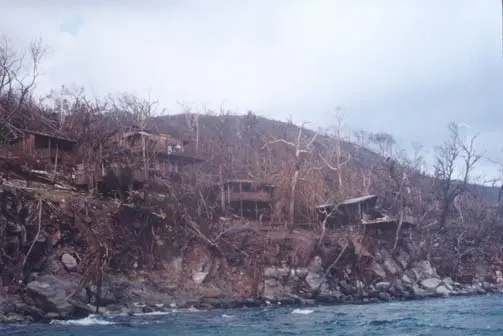
Forty-five kilometres separate the two islands, and they did not live through the same hurricane. The US Geological Survey surveyed both by air. On Guanaja: category 4 winds, close to 257 km/h, and every forest type stripped: mangrove, montane rainforest, highland pine. Every tree lost all of its leaves at a minimum.
On Roatán, the same report reads: forest damage was "much more patchy and confined to its eastern end", the island being far enough west to take "maximum windspeeds of 115 mph or less", so 185 km/h at most.
Mitch bounced off the steep northern coast of the mainland and wobbled offshore, which is why it hit the islands with hurricane-force winds on three separate passes.
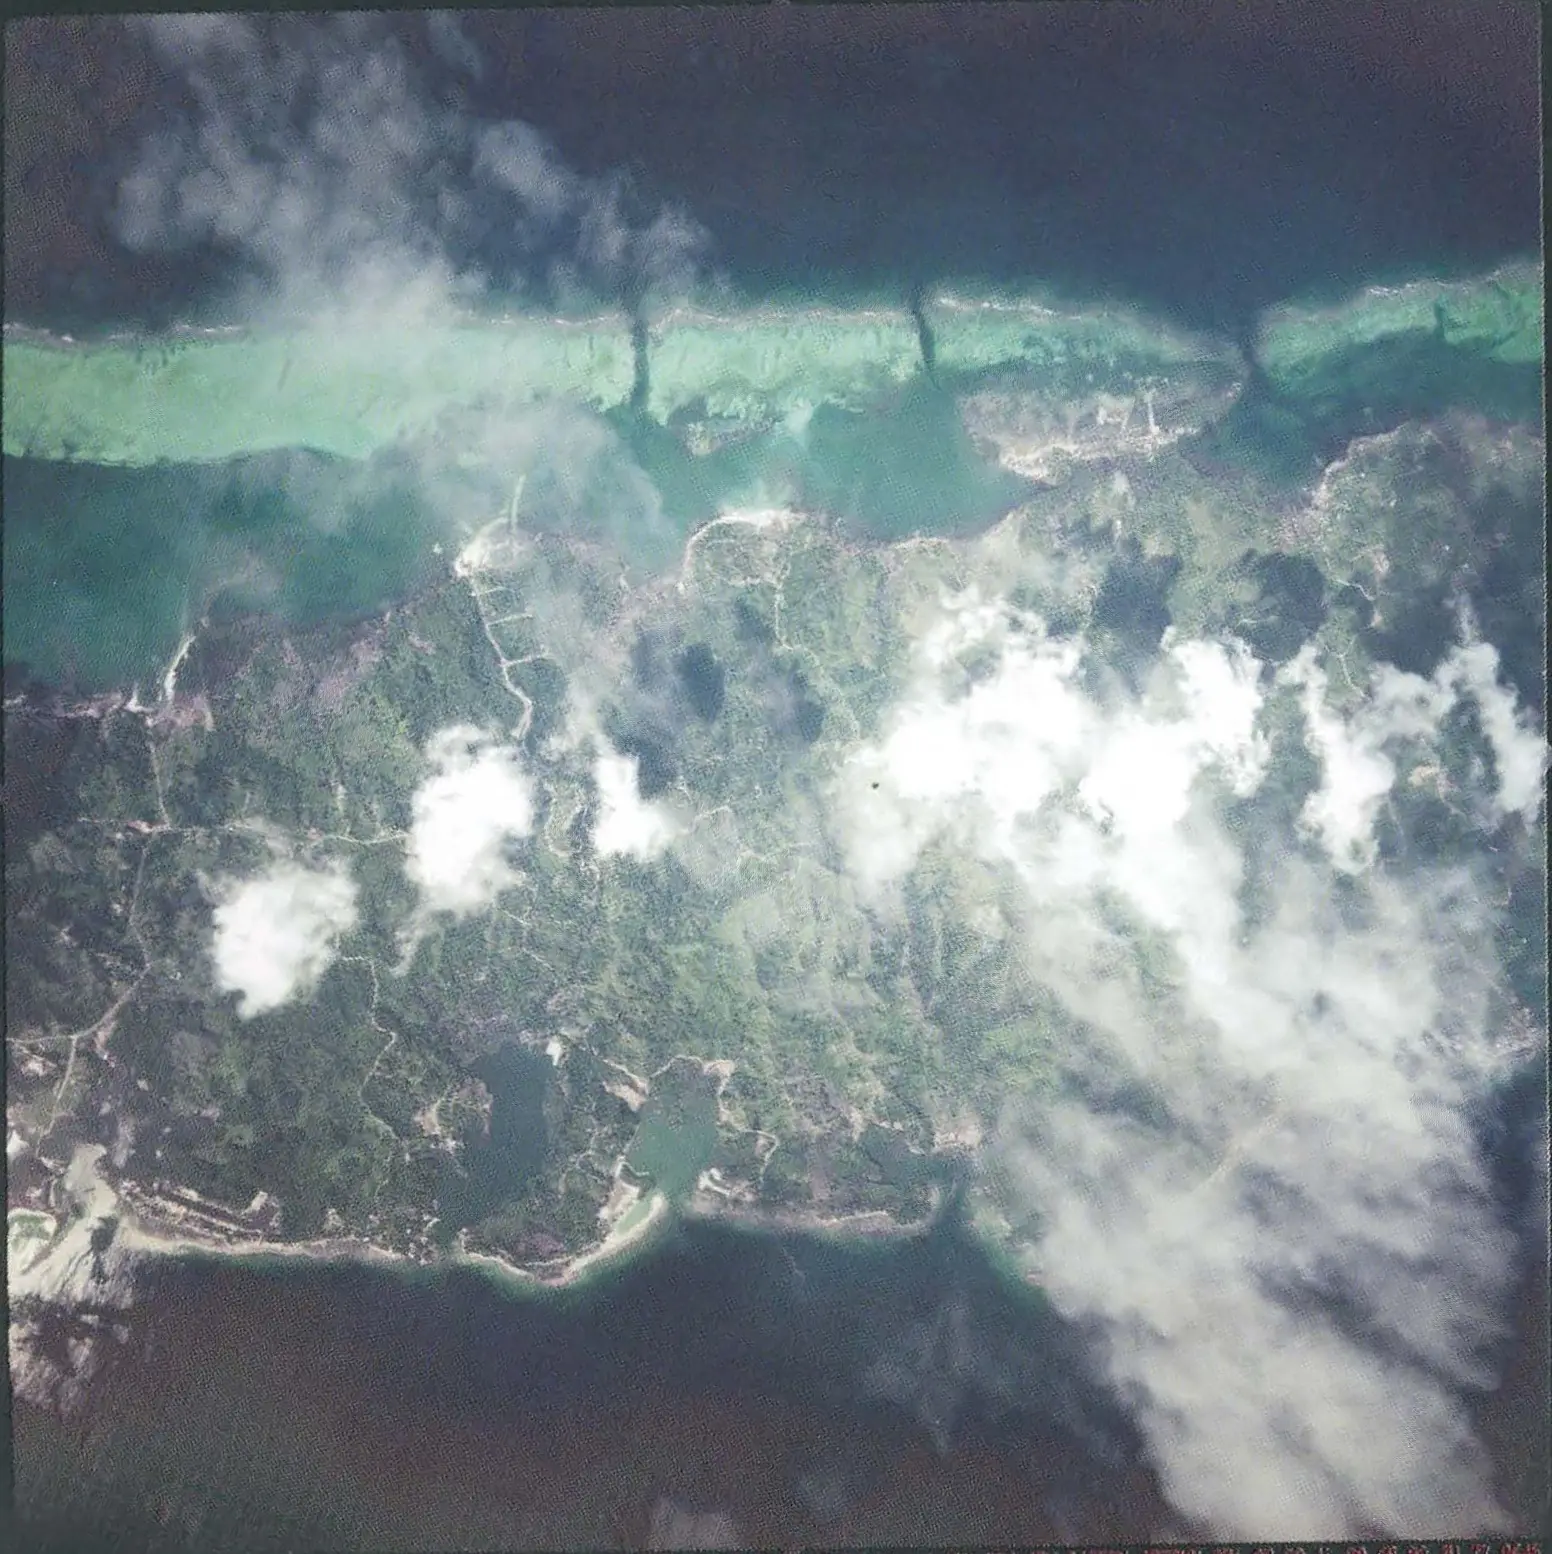
Five weeks after Mitch, on 4 December 1998, an Open Skies aircraft photographed central Roatán from above. The official caption says that although many reefs show erosional grooves, "major destruction of these reefs did not occur". The same sentence adds that sediment effects cannot be judged from the air, and that extensive reef damage was reported elsewhere. On Roatán, it held.
Iris, 2001 : the strongest ever over Roatán, and nothing broke
Iris passed 79 km away at category 4, 213 km/h: the strongest wind ever recorded over this island. The Red Cross put its Bay Islands branches on red alert and the islands got heavy rain. Honduras reported no damage.
Observers on Roatán recorded gusts up to 93 km/h. More than 90 people went to shelters across the Bay Islands. No deaths and no injuries were reported in Honduras.
The National Hurricane Center posted a hurricane warning for Roatán and the other Bay Islands. The centre passed just to the north and went on to Belize. A storm surge of 0.3 to 0.9 metres and up to 200 mm of rain were forecast for the islands.
Edith, 1971 : why one storm carries two very different numbers
Edith struck Cabo Gracias a Dios as a category 5, 260 km/h, and destroyed nearly every house there. Crossing Nicaragua and Honduras broke it. By the time it passed 45 km from Roatán it was a category 1 at 120 km/h. That is the whole distance between the two columns in the table above.
Francelia 1969, Anna 1961 and Abby 1960 have no source we consider solid: only encyclopedia entries. Greta 1978 and Fifi 1974 have nothing at all about the islands from an independent source. They stay in the table with their measured numbers and no story. Inventing one would cost more than it would gain.
What it looked like, in 1998
These are the only archive photographs of the Bay Islands after Mitch that are freely usable. Both come from the US Geological Survey, which makes them public domain, not from a stock library.
Roatán from above, 4 December 1998 at 19:37, five weeks after Mitch. The reef line runs across the top, the island below. Open Skies mission, frame 645. The island is green. That is the point: the same survey reported that although many reefs showed erosional grooves, major destruction of the reefs did not occur here.Straightened by us: the frame is printed at an angle in the report. Rotation measured at 20.0°, by fitting its four edges. Nothing else was cropped but the black film edge.Open Skies aerial photography (USGS Circular 1181) · Public domain, works of the US government
Guanaja, late 1998. Pine, hardwood and mangrove sites after Mitch. Every tree lost all of its leaves at a minimum. The report does not name a village for any of these five photographs, so neither do we. Their size is the source’s own: 450 pixels wide at best.Damaged forest resources of the Bay Islands (USGS OFR 03-175) · Public domain, works of the US government
Which month storms actually pass Roatán
In 43 recorded approaches since 1892, not one came in January, February, March, April, May and December.
JJanuary : 0 storms0
FFebruary : 0 storms0
MMarch : 0 storms0
AApril : 0 storms0
MMay : 0 storms0
JJune : 4 storms4
JJuly : 4 storms, 3 as hurricanes4
AAugust : 3 storms3
SSeptember : 15 storms, 6 as hurricanes15
OOctober : 14 storms, 5 as hurricanes14
NNovember : 3 storms, 1 as a hurricane3
DDecember : 0 storms0
storms recorded within 100 km of the island, by month
September and October account for 29 of the 43, or 67%.
A month with no storm on record since 1892 is not a month where nothing can happen. It is a month where nothing has. We keep the distinction, because a record is not a guarantee.
Where the storms came from
Every one of the 43 tracks recorded within 100 km of Roatán since 1892, drawn from NOAA's own positions. 27 of them approached from the north — which is what “the southern edge of the belt” actually looks like.
reached hurricane strength on approach (15)
tropical storm or weaker (28)
50 and 100 km from the island
Roatán
Closest approach: 7 km. 17 of the 43 came within 50 km.
No coastline is drawn: what matters here is where the tracks converge and how close they got, not the geography. The 100 km circle is also the selection radius of the dataset — no storm further out appears here, and none is missing from it either.
One approach every two to three years, all intensities combined. One hurricane about
every five years. That is not much, and it is concentrated in two
months: October and November, the wettest of the year. From January to
September the question barely arises. The month-by-month detail is on
the island guide.
And if a storm is forecast during your stay
A Caribbean storm announces itself days ahead: it is a forecast, not a surprise. If your
excursion cannot sail because of weather, you do not lose out : we
reschedule, or your deposit is refunded. I have lived on the island since 2014, I follow
the advisories like everyone here, and I will always tell you what I see rather than
what suits me.
Use this on your own site
This record does not exist anywhere else: 43 storms within 100 km of Roatán, computed from the NOAA database, with a live check of the National Hurricane Center. If it is useful to your readers, take it: it is free and it updates itself.
Paste this where you want it to appear. The attribution line is part of the code; please keep it.
<iframe src="https://roatanquebecois.ca/en/roatan/hurricanes/widget/" title="Hurricane record for Roatán" id="rq-ouragans"
  width="100%" height="700" loading="lazy" style="border:0;max-width:560px"></iframe>
<script>addEventListener('message',function(e){if(e.origin==='https://roatanquebecois.ca'&&e.data
  &&e.data.rqOuragansHauteur){document.getElementById('rq-ouragans')
  .style.height=e.data.rqOuragansHauteur+'px'}});</script>
<p style="font:13px sans-serif;color:#5a6674;margin:6px 0 0">Data: NOAA HURDAT2, compiled by
  <a href="https://roatanquebecois.ca/en/roatan/hurricanes/">Hurricane record for Roatán</a></p>